

You’ll receive an audiogram during your first audiology appointment. Understanding the results allows you to understand what’s going on with your hearing.
What is an Audiogram?
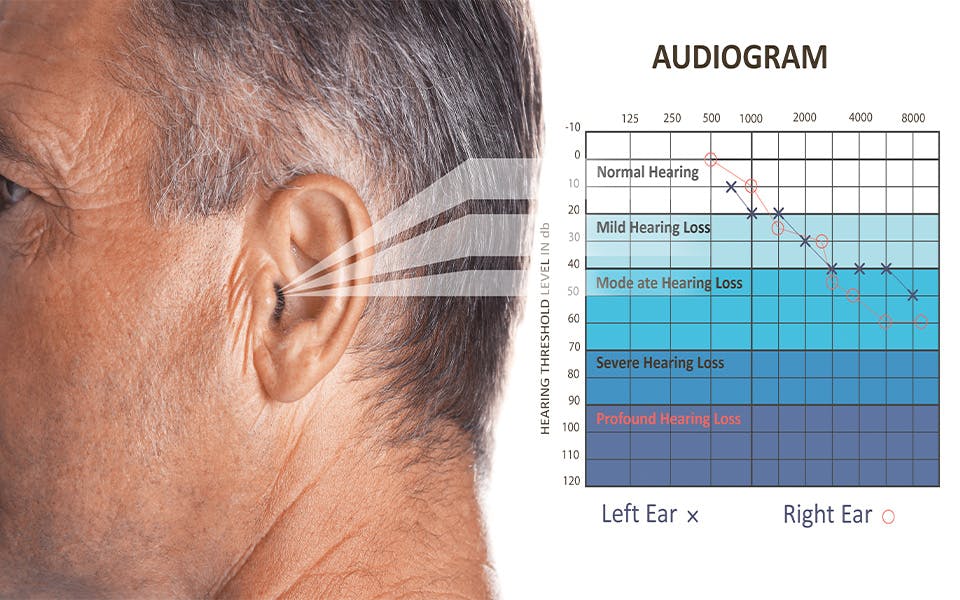
An audiogram shows the results of your hearing test, specifically your degree of hearing loss. It’s a chart that displays the softest sounds, pitches and frequencies you’re able to hear.
Understanding the Symbols of an Audiogram
An audiogram is displayed as a graph. The left side of an audiogram (Y-axis) shows hearing levels measured in decibels and the top portion (X-axis) shows sound frequency measured in Hertz.
Your results show what pitches and volumes you can hear in your right and left ears. Your left ear is usually represented by an “X” or square and your right is designated with an “O” or a triangle.
Reviewing Your Audiogram Results
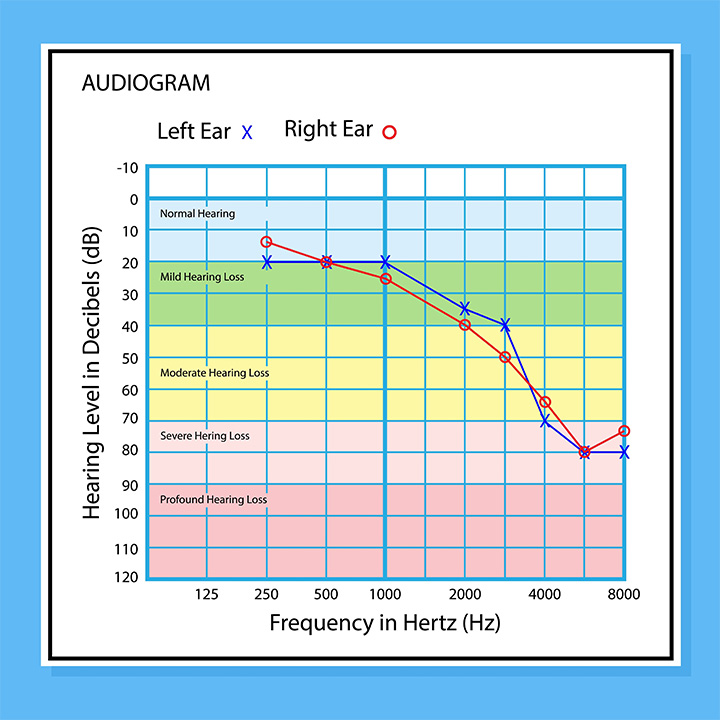
Your audiogram results will be mapped on the graph, and their position indicates your level of hearing loss.
Hearing loss categories run from top to bottom on an audiogram in the following order:
- Normal hearing ability
- Mild hearing loss
- Moderate hearing loss
- Moderately severe hearing loss
- Severe hearing loss
- Profound hearing loss
The points on the graph reveal which frequencies you struggle to understand. That information will help your audiologist recommend appropriate treatment.
Levels of Hearing Loss Associated with Your Results
Normal hearing: Results are within -10 to 20 decibels on the Y-axis and stay clustered toward the top of the chart.
Mild hearing loss: This type of hearing loss falls between 20 to 40 decibels on the Y-axis. You may have trouble hearing soft speech, especially when there’s background noise.
Moderate hearing loss: Results indicating moderate hearing loss range between 40 to 70 decibels on an audiogram. You might have increased difficulty hearing one-on-one conversations and ask others to speak up or repeat themselves frequently.
Severe hearing loss: This type of hearing loss is between 70 to 90 decibels. You’ll likely struggle to hear speech at a normal volume, whether you’re conversing in person or over the phone. Turning up the volume repeatedly on your TV or radio is another sign of severe hearing loss.
Profound hearing loss: Profound hearing loss is represented by points below 90 decibels on an audiogram. You may lack a response to any sound and face significant communication challenges. Social withdrawal is also common if you have profound hearing loss.
Who Should Get an Audiogram?
Your risk of hearing loss increases with age, so it’s important to schedule an annual hearing test if you’re 50 or older. You may also want to get evaluated if you or your loved ones notice changes in your hearing.
Health conditions like cardiovascular disease and diabetes are comorbidities of hearing loss, so plan for regular hearing tests to monitor your hearing.
What To Do with Your Audiogram Results
Your test results should provide you with insight into your hearing health. You may find your hearing loss isn’t as significant as you thought, or realize it’s time to seek treatment.
Along with an otoscopy and other hearing tests, your audiogram results with help your audiologist determine the cause of your hearing loss. That information allows them to prescribe personalized treatment.
That could include treating ear infections, removing wax buildup, wearing hearing aids or using hearing amplifiers. Keep a copy of your audiogram, so your doctor has a baseline to measure hearing changes against in the future.
Hearing Tests in Northern Iowa and Southern Minnesota
Your hearing impacts your quality of life, which is why it’s important to determine if you have hearing loss. Hearing Associates provides comprehensive hearing testing to provide you with a thorough analysis of your hearing health. Call 888-760-2032 or schedule your appointment online.